Electrify Chicago
According to the
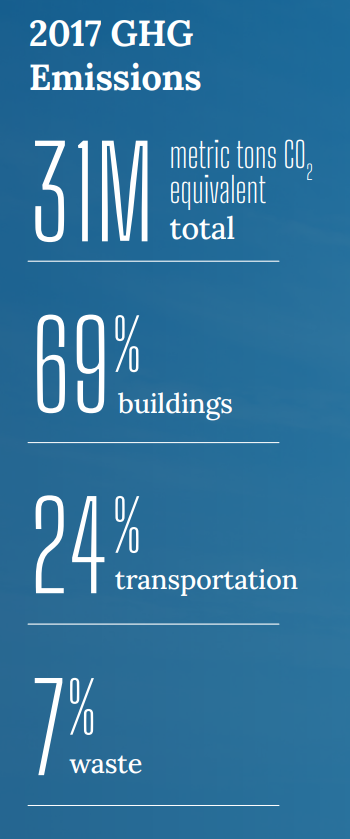
2022 Chicago Climate Action Plan ,
a whopping 69% of Chicago's emissions come from buildings, making it
our biggest challenge and our biggest opportunity as a city to tackle
change. At Electrify Chicago we want to showcase some of the best and worst performing
buildings in the city using publicly available data and manual annotations to add
building photographs and label multi-building owners like universities.
,
a whopping 69% of Chicago's emissions come from buildings, making it
our biggest challenge and our biggest opportunity as a city to tackle
change. At Electrify Chicago we want to showcase some of the best and worst performing
buildings in the city using publicly available data and manual annotations to add
building photographs and label multi-building owners like universities.
You can start by looking at Chicago's buildings with the highest greenhouse gas intensity - this means that they use the most energy when adjusted per unit of square foot, so big buildings could actually perform much better than very inefficient small buildings on this metric.
Chicago Buildings by Greenhouse Gas Intensity
Note: Data only includes large Chicago buildings from 2020
Note: This data only includes buildings whose emissions are reported
under the
Chicago Energy Benchmarking Ordinance. According to the City “As of 2016,
this list includes all commercial, institutional, and residential buildings larger than
50,000 square feet.” This dataset is also then filtered to only buildings with
reported emissions > 1,000 metric tons CO2 equivalent.
This data is also from 2020, but when new benchmark data is available, we'll update the site.
| Property Name / address | Primary Property Type |
Greenhouse Gas Intensity (kg CO2 eq./sqft) |
Total Greenhouse Emissions (metric tons CO2 eq.) |
|---|---|---|---|
|
Keating Hall
🚨
📷
(Illinois Tech)
3040 S Wabash Avenue
| College/University | 461.6 kg/sqft #1 Highest
| 24,538 tons #12 Highest
|
|
Digital Lakeside
🚨
📷
350 E Cermak
| Data Center | 142.1 kg/sqft #2 Highest
| 173,706 tons #1 Highest
|
|
352 360 W WELLINGTON AVE
🚨
📷
352 360 W WELLINGTON AVE
| Multifamily Housing | 136.5 kg/sqft #3 Highest
| 19,870 tons #24 Highest
|
|
CoreSite
🚨
📷
427 S LaSalle St
| Data Center | 114.3 kg/sqft #4 Highest
| 18,282 tons #31 Highest
|
|
Digital Printer's Row
🚨
📷
600 S Federal St
| Data Center | 105.8 kg/sqft #5 Highest
| 18,979 tons #27 Highest
|
|
Herman Hall
🚨
📷
(Illinois Tech)
3241 S Federal Street
| College/University | 89.2 kg/sqft #6 Highest
| 9,912 tons
Highest 6%
|
|
Tech Business Center
🚨
📷
(Illinois Tech)
3440 S Dearborn Street
| College/University | 87.0 kg/sqft #7 Highest
| 12,246 tons
Highest 4%
|
|
Shop & Save Market - Nagle
🚨
📷
6312 N Nagle Ave
| Supermarket/Grocery Store | 83.7 kg/sqft #8 Highest
| 5,584 tons
Highest 13%
|
|
6045 Kenwood Building
🚨
📷
(UChicago)
6045 S Kenwood Ave
| Office | 51.1 kg/sqft #9 Highest
| 5,069 tons
Highest 15%
|
|
Lowden Homes
🚨
📷
200 W 95th St
| Multifamily Housing | 48.1 kg/sqft #10 Highest
| 5,530 tons
Highest 13%
|
|
William Eckhardt Research Center
🚩
📷
(UChicago)
5640 S ELLIS AVE
| Laboratory | 46.2 kg/sqft #11 Highest
| 13,137 tons #50 Highest
|
|
Searle Chemistry Laboratory
🚩
📷
(UChicago)
5735 S Ellis Ave
| Laboratory | 45.4 kg/sqft #12 Highest
| 3,885 tons
Highest 22%
|
|
Salem Baptist Church of Chicago
🚩
10909 S Cottage Grove Ave
| Worship Facility | 42.9 kg/sqft #13 Highest
| 3,941 tons
Highest 22%
|
|
McGowan North
🚩
(DePaul)
2325 N Clifton Ave
| College/University | 42.6 kg/sqft #14 Highest
| 2,386 tons
Highest 41%
|
|
Whole Foods KBS
🚩
1550 N Kingsbury St
| Supermarket/Grocery Store | 37.9 kg/sqft #15 Highest
| 3,767 tons
Highest 23%
|
Data Source:
Chicago Energy Benchmarking Data